User login
News
TQ_Hist
 TQ_Hist: the program for plotting histograms in TriQuick
TQ_Hist is a small and simple program for plotting histograms in TriQuick. Histograms in TQ_Hist have horizontal axis with rational values, bars are placed between the borders of intervals (in contrast to standard ©MS Excel bar charts).
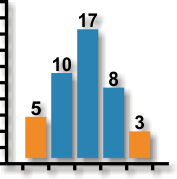
Histograms have the following form:
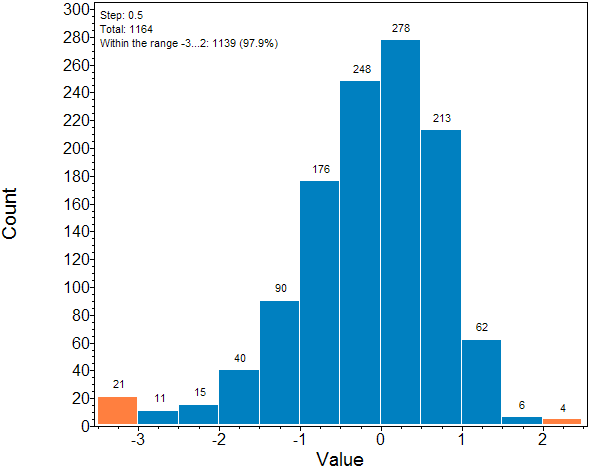
The program takes unidimensional array of rational numerical data and counts numbers of values that fall within specified intervals. Histograms may have additional boundary bars filled by another color (orange in this case) showing data that fall outside the specified total range (divided into intervals of a certain width). These bars point to the presence of incorrect data or insufficient total range of values. The program operates in a single window where you can set all parameters and view the table of results:
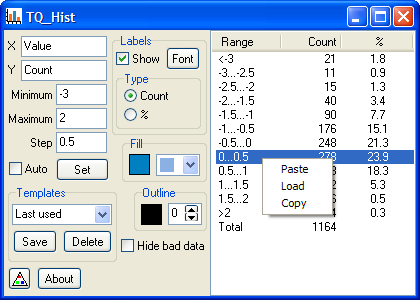
You can load source data from a text file or paste it from the Windows clipboard. For example, you can select and copy the whole column in ©MS Excel and paste it to TQ_Hist.
The TriQuick program acts as a server of diagram graphics: TQ_Hist re-writes the file Hist.tvl with a histogram image at every change of settings and sends message for TriQuick to show it.
TQ_Hist is a freeware, it works under the ©MS Windows family of operating systems. The program is distributed as zip-archive: extract folder with all compressed files to any desired place on your HD or another drive to install it.
If you like these programs and want to support their development, you can make a donation here