Вход на сайт
Новости
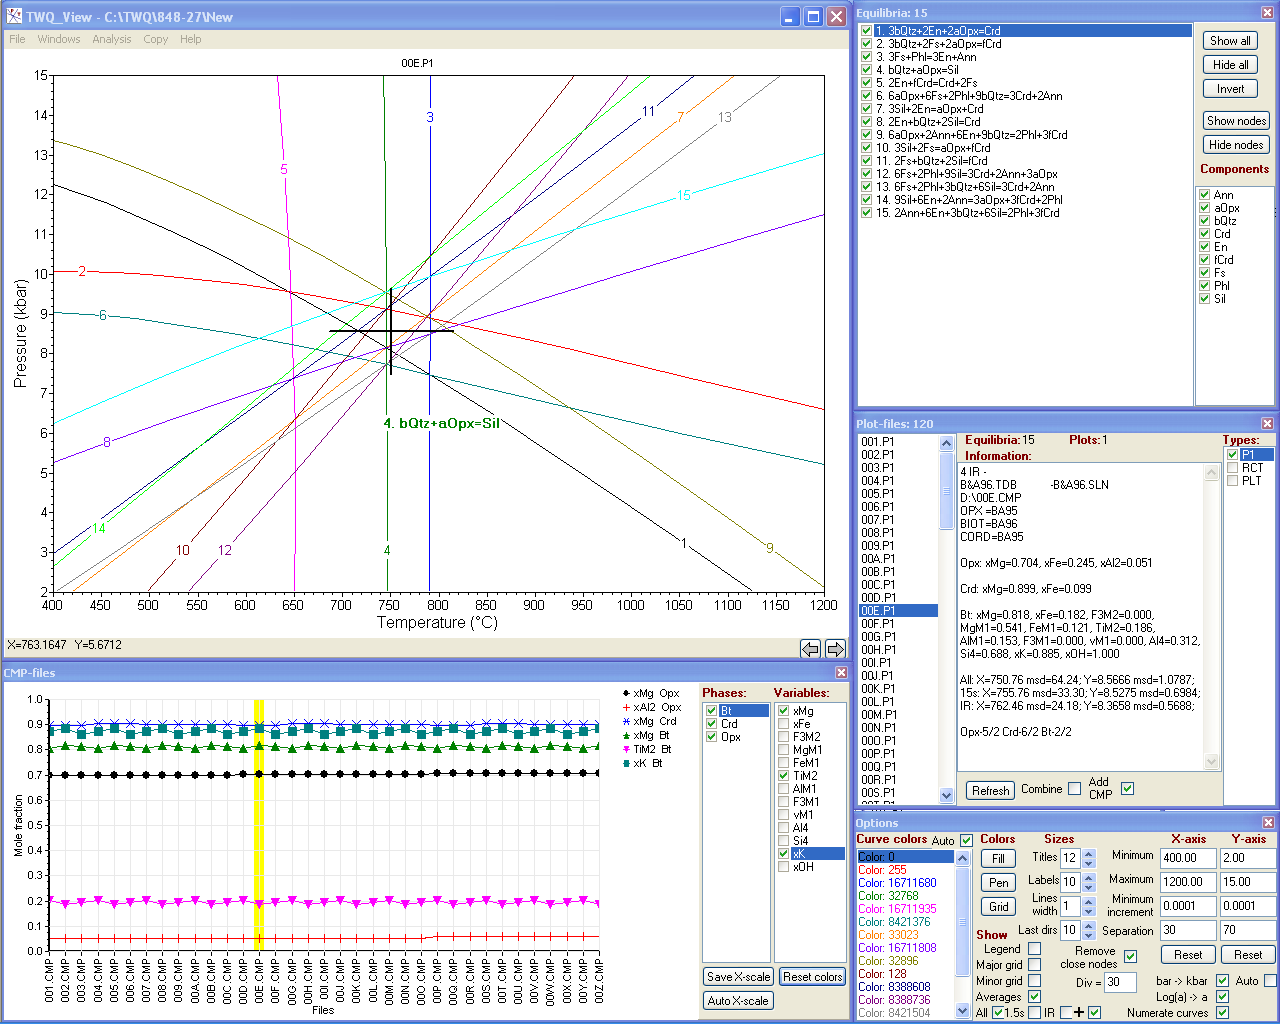
TWQ_View
 TWQ_View: программа для просмотра и работы с диаграммами, рассчитанными в программном комплексе TWQ Р. Бермана (1991), используемом для мультиравновесной геотермобарометрии
TWQ_View – это удобная и бесплатная Windows-программа для просмотра и базовой работы с диаграммами, рассчитанными в известном программном комплексе для геотермобарометрических исследований TWQ/winTWQ Р. Бермана, Т. Брауна, Э. Перкинса и Дж. Эллвуда. Вы можете запускать с помощью интерфейса программы как DOS-версию INTERSX, так и winTERSX из Windows-версии комплекса в пакетном режиме. Кроме того, 16-битная DOS-программа INTERSX может запускаться и под 64-битной операционной системой (Windows Vista, 7, 8 и 10) благодаря встроенной поддержке двух DOS эмуляторов (DOSBox или vDOS), которые необходимо скачать и установить самостоятельно.
С помощью TWQ_View Вы можете:
- отображать TWQ-диаграммы на экране;
- изменять их внешний вид;
- отмечать кривые разными цветами и находить определённые равновесия как щелчками по кривым, так и выбором их в списке;
- менять масштаб диаграмм;
- перемещаться по диаграммам;
- показывать/скрывать выбранные кривые и наборы кривых, содержащих выбранные компоненты;
- объединять диаграммы;
- быстро выбирать и отображать диаграммы, находящиеся в одном каталоге (из их списка);
- графически отображать составы фаз (мольные доли компонентов/элементов) для списка CMP-файлов;
- запускать программу INTERSX.EXE/winTERSX для отдельных или сразу для всех диаграмм, находящихся в одном каталоге (с помощью циклических перезапусков этой программы, необходимых из-за присущих ей частых аварийных завершений), даже для отдельных выбранных реакций;
- отображать вычисленные средние значения (с их среднеквадратическими отклонениями) на диаграммах вместе с кривыми равновесий;
- искать диаграммы с наилучшим схождением пересечений с помощью сортировки таблицы средних значений;
- менять единицы давления (бар→кбар) и активностей (Log(α)→α);
- автоматически заменять аббревиатуры минералов на предпочитаемые (находящиеся в редактируемом списке замен);
- копировать диаграммы в буфер обмена Windows в векторном виде (в формате графического метафайла, WMF) для последующей вставки в другие программы (например, в ©CorelDraw или ©MS Word).
С программой TWQ_View можно ассоциировать расширения файлов диаграмм (например *.PLT, *.P1) и просматривать диаграммы простыми щелчками по именам их файлов в файловом менеджере.
Как правило, TWQ_View используется в комплексе с программой TWQ_Comb.
Демонстрация работы с программой TWQ_View (версии до 1.3.0.0)
Расчёт средних P-T параметров:
Определение активности воды:
Большое обновление от 28.03.2022. Наиболее существенные изменения связаны с добавлением поддержки Windows-версий пакета winTWQ:
- Окно "TWQ Settings" (меню Analysis – Database...): галочка Win служит для выбора DOS или Windows версии TWQ. Каталоги и исполняемые файлы обоих пакетов указываются с помощью кнопки [win]TWQ directory в верхней части окна.
- Для удобства работы в пакетном режиме с winTERSX может использоваться специальная служебная утилита AppCtrl, которая берёт на себя управление программами.
- Для DOS-версии TWQ добавлена поддержка альтернативного DOS эмулятора vDOS, который работает заметно быстрее, чем DOSBox. NB! При некорректных настройках безопасности в Windows эмулятор vDOS может ававрийно завершаться с сообщением "vDOS should not run elevated". Простым решением является помещение строчки "ADMIN=ON" в его файл config.txt.
- Изменения коснулись INI-файла: часть переменных изменила формат и добавились новые.
- Обновлён файл справки. В нём следует обратить особое внимание на раздел "Требования и установка".
Кроме того, ожидается обновление и самого пакета winTWQ, в котором будут сделаны некоторые усовершенствования и исправления ошибок. Последние версии можно найти на новом сайте пакета http://twq.petrochronology.org.
- Войдите или зарегистрируйтесь, чтобы отправлять комментарии
Если Вам понравились программы и Вы хотите поддержать их разработку, то здесь можно сделать пожертвование
Комментарии
Hi
Hi
Thank you for this very nice program.
I have a small problem
I am trying to calculate P-T of the following mineral assemblage (cd g fsp bi q sill H2O). Assuming water activity is 1.
I went to the parameters and entered the aH2O=1 and the aCO2=0. Then I started the calculation -- the THERMOCALC was stopped the calculation with an error message. In the tc-log file, I found this error
"
specification of PT window:
PT window: 5.0 <=> 25.0 kbar; 100 <=> 1500¡C (from script)
T window : 100 <-> 1500¡C :T interval = 100 (from script)
for cordierite activity calculation
fixed a(CO2), a(H2O) : y
: y
y not a real: replace with : n
n not a real: replace with : (nothing input)
: (nothing input)
:
not a real: replace with :
not a real: replace with :
not a real: replace with :
not a real: replace with :
not a real: replace with :
not a real: replace with :
not a real: replace with :
not a real: replace with :
not a real: replace with :
not a real: replace with :
not a real: replace with :
not a real: replace with :
not a real: replace with :
not a real: replace with :
"
It seem to be there is a conflict between the cd and the activity of H2O and CO2.
Could you please help in this point??
Tamer
dT и dP
Здравствуйте, Дмитрий! Могу ли я написать в подписи к рисунку, что "dT и dP это параметры сходимости пучка, степень отклонения от среднего значения Т и P"? правильно ли я выражаюсь и ничего ли не надо добавить? Average посчитано с помощью INTERSX..
Hello,
Hello,
It seems that this is the problem in TC_Comb, not TWQ_View...;)
Anyway, yes: this is due to cordierite! This mineral requires input of H2O and CO2 activities in Thermocalc even if the system is "dry" (doesn't contain explicit fluid components in the tc-ax.txt file). Therefore the keyboard macro "Default" is not suitable in this case and you should try another one. Press the "Kbd.lib" button in TC_Comb, select the macro named "Cordierite (aH2O & aCO2)" in the opened window and press the "Use" button.
BTW, you can double-click on any record in the "Results" window (even with failed calculations) and look at the Thermocalc screen output in the separate window. Type of calculations (avPT or Rct) can be selected in the main TC_Comb window. This way may be more convenient than checking of tc-log.txt.
Cheers,
Dmitry
dT и dP
Здравствуйте, Татьяна!
Да, именно так и надо писать, смысл именно такой. Это - среднеквадратические отклонения всех учтённых парных пересечений линий реакций от вычисленного среднего значения по двух осям.
Спасибо!
Спасибо!
Guys i need help, ive got
Guys i need help, ive got electron microprobe results and cannot paste them in this software, says ID number is absent always, why?
Hello,
Hello,
Do you mean TWQ_Comb? Input files for TWQ_View are only plot-files generated by TWQ.exe...
Tables for TWQ_Comb should contain columns with mineral abbreviations and with IDs (numbers) of analyses. These identifiers are required to know which analysis of some mineral is used in particular combination. TWQ_Comb determines the column with IDs of analyses by its header. You can find list of possible headers in TWQ_Comb.ini, at the end of this file:
Spot=SPOT;POINT;PROBE;ANALYSIS;AN
You can freely edit this list and add more headers, but make sure that it is not intersected with the other lists (with headers for mineral abbreviations, sample ID, Area ID, Selection).
winTWQ installation
I have some queries regarding installation of wintwq ver 2.64. I have installed ww_icl_redist_intel64_2019.3.203.msi on my windows PC as suggested in readme file. However when I run the exe. files, two system error files pop up, libifcoremd.dll and VCRUNTIME140.dll was not found, please try reinstalling the program. I have tried that but without any success. I am a new user and it will be very helpful if you can suggest a possible solution. Thanking you.
winTWQ installation
Hi!
Thank you for information about ver. 2.64 of winTWQ, I've just found it on the new TWQ site and tried to
installrun. Yes, required libifcoremd.dll is missing. After a very quick Google search, I've downloaded this Intel Visual FORTRAN library from this site to the winTWQ folder - and now winTWQ executables work as expected.I think that issue with VCRUNTIME140.dll (Microsoft Visual Studio library) can be solved by the same way. I already have this library.
winTWQ installation
Hi all,
Installing newest version of redistributable Intel© Fortran libraries should solve many issues with missing dll files. You can find them here: Redistributable Libraries for Intel® C++ and Fortran 2019 Compilers for Windows* (the last item in the right column at the page bottom), direct link to the cuurent version for 32-bit and 64-bit systems: ww_ifort_redist_msi_2019.6.324.zip
solution models of chlorite
Hi Prof. Dmitry,
Many thanks for your helpful suggestions, it worked! I was able to plot a simple alumino-silicate phase diagram and used TWQ_View to open the plot file. The program is very user friendly. Thanks again. I wanted to use this software to calculate chlorite-phengite equilibration temperature, using the models of Para et al. (2002) and Vidal et al. (2001). However, I could not find these models in the downloaded program. Any idea where I can download these models to use it in winTWQ? Any help will be much appreciated. Thank you.
solution models of chlorite
As far as I understand, that series of works devoted to chlorites by O. Vidal, T. Parra et al. is an independent research which just use TWQ and its datafiles as a convenient calculation tool, it is not connected with development of (win)TWQ and its original database. I don't know where you can find this modified database with additional thermodynamic data on chlorite endmemebers and solution models. I think you can contact with authors (Olivier Vidal and/or Teddy Parra) and ask them.
Thank you, Prof. Dmitry, for
Thank you, Prof. Dmitry, for your helpful comments and suggestions. I will try to contact the authors regarding this.
Thanks and regards,
HAVING TROUBLE IN WINDOWS
I HAVE DOWNLOADED WIN TWQ AND TWQ_VIEW AS WELL...have calculated p-t using twq but in twq_view when i opened the plot i cant access the "OPTION" WINDOW IN TWQ_VIEW... m clicking several times on option in window section and nothing happening...i need to change activity scale which i cnt ...plz help
HAVING TROUBLE IN WINDOWS
Hi Rishabh,
It seems that the "Options" window is invisible because it appears outside the screen. The simple solution is to make a small correction in the file TWQ_View.ini (after exiting the program). Find there section "Desktop=Default" (near the line #60) and correct the first value of the variable "WinOpt=" below (the X coordinate of the top-left corner), replace it e.g. by "800" and run the program again.
I really regret this shortcoming, which appeared in the distributive after the last update! I will fix the INI-file tomorrow. I also have to add a check for this situation to the code.
Sincerely,
Dmitry
Regarding water activity and oxygen fugacity
Sir, with due respect i have one request...plz give link to tutorial or handbook on how to calculate water activity and oxygen fugacity...i have calculated P-T condition for my paper using my data but i am having trouble in making graph for water activity and oxygen fugacity...it will be a great help sir if you could. i tried your method for water activity but its not working since no file is showing in plot files in twq view
Regarding water activity and oxygen fugacity
Dear Rishabh,
First of all, your assemblage must include OH-bearing minerals, e.g. mica or amphibole, to produce some reactions with H2O. The general workflow is:
I've never calculated oxygen fugacity in TWQ. However, I think that the workflow is very similar. Minerals with Fe3+ are required in your actual assemblage (magnetite, hematite), or any other that contain elements with different oxidation states - to calculate reactions with free oxygen. "Oxygen gas" should be specified for X axis.
Although I also think that in many cases dedicated independent oxybarometers may be more suitable for oxygen fugacity calculations. You can find some oxybarometers in PTQuick program.
Regards,
Dmitry