User login
News
TWQ_View
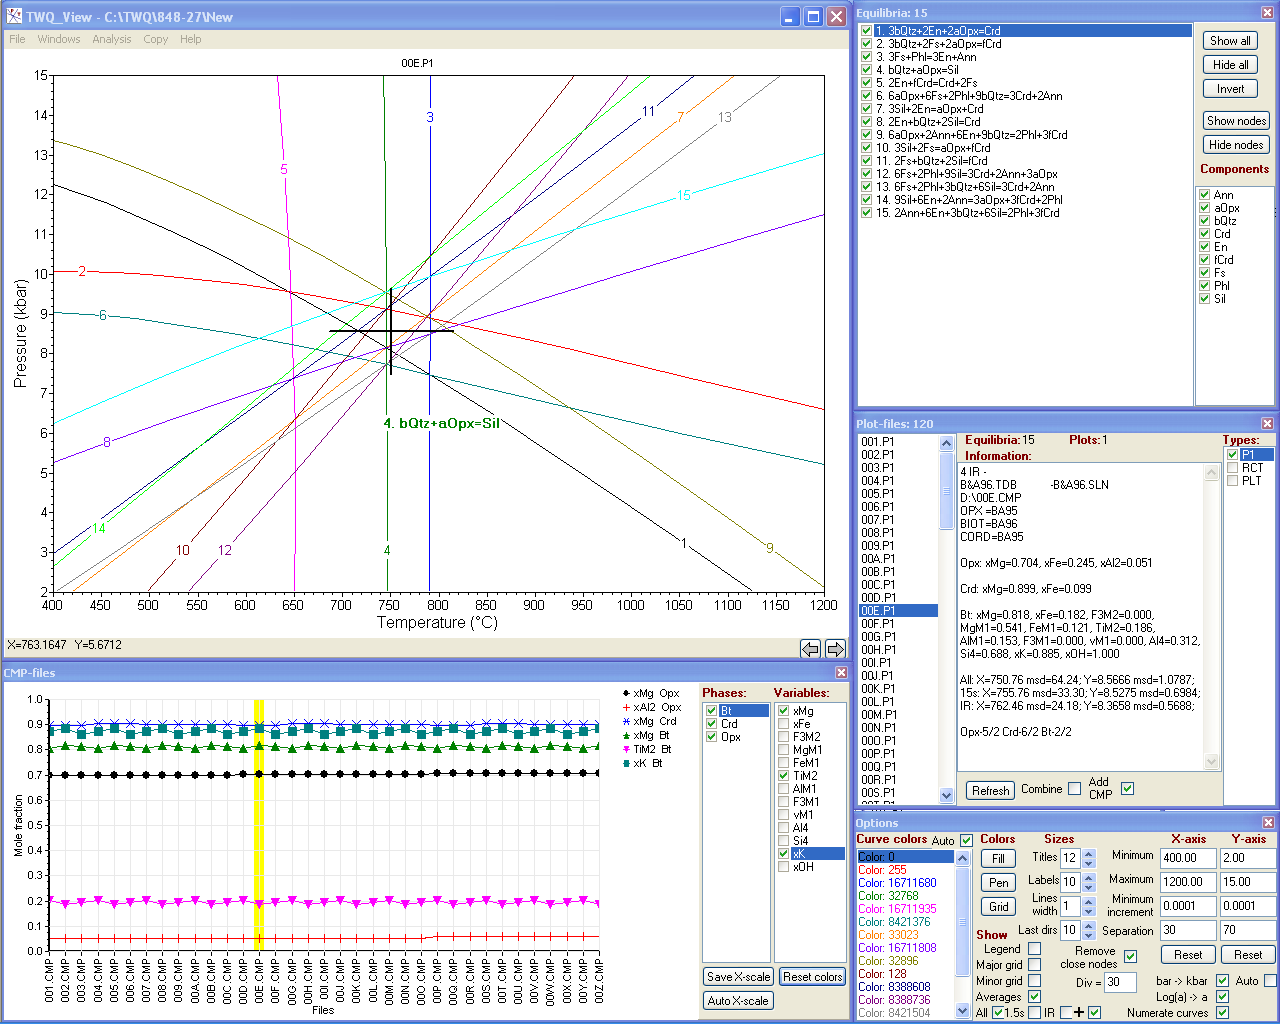
 TWQ_View: the program for viewing and work with diagrams generated by the TWQ program of R.G. Berman (1991) used for multi-equilibrium geothermobarometry
TWQ_View is a handy ©MS Windows freeware for viewing and basic work with diagrams generated by the TWQ/winTWQ program package of R.G. Berman, T.H. Brown, E.H. Perkins and J. Ellwood. You can run either DOS version of INTERSX or winTERSX from the Windows version of the package via the program interface in the batch mode. You can also run 16-bit DOS version of INTERSX under 64-bit OS (like Windows Vista, 7, 8 and 10) due to implemented support of two DOS emulators (DOSBox and/or vDOS) which should be loaded and installed by yourself.
With TWQ_View you can:
- display diagrams;
- adjust their design;
- colorize curves and find specific equilibria (by clicking on curves as well as by selecting from the list);
- zoom;
- scroll;
- show / hide specified curves and sets of equilibria containing specified components;
- combine diagrams;
- browse diagrams by moving through the list of plot-files;
- plot compositions of phases (mole fractions of components/elements) for the list of compositional files;
- run INTERSX/winTERSX via the program interface for selected plot-files or for all plot-files in the directory (using complicated cyclic batch mode process for handling frequent fatal terminations of the program), even for selected reactions only;
- display averaged values (with deviations) on diagrams together with equilibria;
- search plot-files with best convergence of intersections using sorted lists of averages;
- change pressure units (bar→kbar) and activity scale (Log(α)→α);
- replace abbreviations automatically by a commonly accepted ones (taken from the editable list);
- copy diagrams to the clipboard as a vector Windows Meta-Files (WMF) with following pasting to any editor of vector graphics (like ©CorelDraw) or to a text processor (like ©MS Word).
You can associate TWQ_View with desired extensions of plot-files (e.g. *.PLT, *.P1) and view diagrams simply by clicking on their files in the file explorer.
TWQ_View is used together with the TWQ_Comb program.
TWQ_View demos (prior to version 1.3.0.0)
Calculation of average P-T values:
Calculation of water activity:
Big update from 03/28/2022. The most significant changes are related to the addition of support for Windows versions of the winTWQ package:
- Window "TWQ Settings" (menu Analysis – Database...): the Win checkbox selects the DOS or Windows version of TWQ. The directories and executable files of both packages are specified using the [win]TWQ directory button at the top of the window.
- For the convenience of working in batch mode with winTERSX, a special service utility AppCtrl can be used, which takes full control over the program.
- For the DOS version of TWQ, support for an alternative DOS emulator vDOS has been added, which is noticeably faster than DOSBox. NB! With incorrect security settings on Windows, the vDOS emulator may crash with the message "vDOS should not run elevated". A simple solution is to put the line "ADMIN=ON" in his config.txt file.
- Some of the variables in the INI file changed their format and new ones were added.
- Help file updated. Pay attention to the "Requirements and installation" section.
In addition, the winTWQ package is expected to be updated with some improvements and bug fixes. The latest versions can be found at the new TWQ site http://twq.petrochronology.org.
If you like these programs and want to support their development, you can make a donation here
Comments
Hi
Hi
Thank you for this very nice program.
I have a small problem
I am trying to calculate P-T of the following mineral assemblage (cd g fsp bi q sill H2O). Assuming water activity is 1.
I went to the parameters and entered the aH2O=1 and the aCO2=0. Then I started the calculation -- the THERMOCALC was stopped the calculation with an error message. In the tc-log file, I found this error
"
specification of PT window:
PT window: 5.0 <=> 25.0 kbar; 100 <=> 1500¡C (from script)
T window : 100 <-> 1500¡C :T interval = 100 (from script)
for cordierite activity calculation
fixed a(CO2), a(H2O) : y
: y
y not a real: replace with : n
n not a real: replace with : (nothing input)
: (nothing input)
:
not a real: replace with :
not a real: replace with :
not a real: replace with :
not a real: replace with :
not a real: replace with :
not a real: replace with :
not a real: replace with :
not a real: replace with :
not a real: replace with :
not a real: replace with :
not a real: replace with :
not a real: replace with :
not a real: replace with :
not a real: replace with :
"
It seem to be there is a conflict between the cd and the activity of H2O and CO2.
Could you please help in this point??
Tamer
dT и dP
Здравствуйте, Дмитрий! Могу ли я написать в подписи к рисунку, что "dT и dP это параметры сходимости пучка, степень отклонения от среднего значения Т и P"? правильно ли я выражаюсь и ничего ли не надо добавить? Average посчитано с помощью INTERSX..
Hello,
Hello,
It seems that this is the problem in TC_Comb, not TWQ_View...;)
Anyway, yes: this is due to cordierite! This mineral requires input of H2O and CO2 activities in Thermocalc even if the system is "dry" (doesn't contain explicit fluid components in the tc-ax.txt file). Therefore the keyboard macro "Default" is not suitable in this case and you should try another one. Press the "Kbd.lib" button in TC_Comb, select the macro named "Cordierite (aH2O & aCO2)" in the opened window and press the "Use" button.
BTW, you can double-click on any record in the "Results" window (even with failed calculations) and look at the Thermocalc screen output in the separate window. Type of calculations (avPT or Rct) can be selected in the main TC_Comb window. This way may be more convenient than checking of tc-log.txt.
Cheers,
Dmitry
dT и dP
Здравствуйте, Татьяна!
Да, именно так и надо писать, смысл именно такой. Это - среднеквадратические отклонения всех учтённых парных пересечений линий реакций от вычисленного среднего значения по двух осям.
Спасибо!
Спасибо!
Guys i need help, ive got
Guys i need help, ive got electron microprobe results and cannot paste them in this software, says ID number is absent always, why?
Hello,
Hello,
Do you mean TWQ_Comb? Input files for TWQ_View are only plot-files generated by TWQ.exe...
Tables for TWQ_Comb should contain columns with mineral abbreviations and with IDs (numbers) of analyses. These identifiers are required to know which analysis of some mineral is used in particular combination. TWQ_Comb determines the column with IDs of analyses by its header. You can find list of possible headers in TWQ_Comb.ini, at the end of this file:
Spot=SPOT;POINT;PROBE;ANALYSIS;AN
You can freely edit this list and add more headers, but make sure that it is not intersected with the other lists (with headers for mineral abbreviations, sample ID, Area ID, Selection).
winTWQ installation
I have some queries regarding installation of wintwq ver 2.64. I have installed ww_icl_redist_intel64_2019.3.203.msi on my windows PC as suggested in readme file. However when I run the exe. files, two system error files pop up, libifcoremd.dll and VCRUNTIME140.dll was not found, please try reinstalling the program. I have tried that but without any success. I am a new user and it will be very helpful if you can suggest a possible solution. Thanking you.
winTWQ installation
Hi!
Thank you for information about ver. 2.64 of winTWQ, I've just found it on the new TWQ site and tried to
installrun. Yes, required libifcoremd.dll is missing. After a very quick Google search, I've downloaded this Intel Visual FORTRAN library from this site to the winTWQ folder - and now winTWQ executables work as expected.I think that issue with VCRUNTIME140.dll (Microsoft Visual Studio library) can be solved by the same way. I already have this library.
winTWQ installation
Hi all,
Installing newest version of redistributable Intel© Fortran libraries should solve many issues with missing dll files. You can find them here: Redistributable Libraries for Intel® C++ and Fortran 2019 Compilers for Windows* (the last item in the right column at the page bottom), direct link to the cuurent version for 32-bit and 64-bit systems: ww_ifort_redist_msi_2019.6.324.zip
solution models of chlorite
Hi Prof. Dmitry,
Many thanks for your helpful suggestions, it worked! I was able to plot a simple alumino-silicate phase diagram and used TWQ_View to open the plot file. The program is very user friendly. Thanks again. I wanted to use this software to calculate chlorite-phengite equilibration temperature, using the models of Para et al. (2002) and Vidal et al. (2001). However, I could not find these models in the downloaded program. Any idea where I can download these models to use it in winTWQ? Any help will be much appreciated. Thank you.
solution models of chlorite
As far as I understand, that series of works devoted to chlorites by O. Vidal, T. Parra et al. is an independent research which just use TWQ and its datafiles as a convenient calculation tool, it is not connected with development of (win)TWQ and its original database. I don't know where you can find this modified database with additional thermodynamic data on chlorite endmemebers and solution models. I think you can contact with authors (Olivier Vidal and/or Teddy Parra) and ask them.
Thank you, Prof. Dmitry, for
Thank you, Prof. Dmitry, for your helpful comments and suggestions. I will try to contact the authors regarding this.
Thanks and regards,
HAVING TROUBLE IN WINDOWS
I HAVE DOWNLOADED WIN TWQ AND TWQ_VIEW AS WELL...have calculated p-t using twq but in twq_view when i opened the plot i cant access the "OPTION" WINDOW IN TWQ_VIEW... m clicking several times on option in window section and nothing happening...i need to change activity scale which i cnt ...plz help
HAVING TROUBLE IN WINDOWS
Hi Rishabh,
It seems that the "Options" window is invisible because it appears outside the screen. The simple solution is to make a small correction in the file TWQ_View.ini (after exiting the program). Find there section "Desktop=Default" (near the line #60) and correct the first value of the variable "WinOpt=" below (the X coordinate of the top-left corner), replace it e.g. by "800" and run the program again.
I really regret this shortcoming, which appeared in the distributive after the last update! I will fix the INI-file tomorrow. I also have to add a check for this situation to the code.
Sincerely,
Dmitry
Regarding water activity and oxygen fugacity
Sir, with due respect i have one request...plz give link to tutorial or handbook on how to calculate water activity and oxygen fugacity...i have calculated P-T condition for my paper using my data but i am having trouble in making graph for water activity and oxygen fugacity...it will be a great help sir if you could. i tried your method for water activity but its not working since no file is showing in plot files in twq view
Regarding water activity and oxygen fugacity
Dear Rishabh,
First of all, your assemblage must include OH-bearing minerals, e.g. mica or amphibole, to produce some reactions with H2O. The general workflow is:
I've never calculated oxygen fugacity in TWQ. However, I think that the workflow is very similar. Minerals with Fe3+ are required in your actual assemblage (magnetite, hematite), or any other that contain elements with different oxidation states - to calculate reactions with free oxygen. "Oxygen gas" should be specified for X axis.
Although I also think that in many cases dedicated independent oxybarometers may be more suitable for oxygen fugacity calculations. You can find some oxybarometers in PTQuick program.
Regards,
Dmitry