User login
News
Tue, 10/11/2022 - 13:59
Mon, 03/28/2022 - 14:40
Fri, 11/01/2019 - 20:13
Wed, 10/24/2018 - 21:14
Wed, 10/03/2018 - 14:48
 This freeware can be used for correction of brightness irregularities (shadows) on SEM images (mostly BSE images) of flat samples...
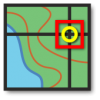 GMxgrid is a ©MS Windows freeware program for working with scanned raster images of topographic maps that performs one important operation: automatic detection of intersections of lines in a strictly rectangular grid. These crosshairs are used as calibration points in correction of distorsions for precise geo-referencing in the GIS software
 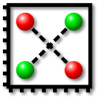 TieLines is a small ©MS Windows program for plotting rectangular and ternary diagrams with tie lines connecting points with equal identifiers.
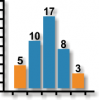
If you like these programs and want to support their development, you can make a donation here