Diagrams

MassBalance

MassBalanceMassBalance is a very simple freeware ©MS Windows program designed to compare chemical analyses of rocks representing successive alteration stages (metasomatic, weathering, etc.).

TWQ_View

TWQ_ViewTWQ_View is a handy ©MS Windows freeware for viewing and basic work with diagrams generated by the TWQ/winTWQ program package of R.G. Berman, T.H. Brown, E.H. Perkins and J. Ellwood...

TriQuick

TriQuickTriQuick is a general purpose plotting ©MS Windows program for creation and working with rectangular and ternary scatter diagrams and for viewing, creation and primitive editing of diagram graphics. TriQuick is also used as a server for displaying diagrams created in some of my other programs and its presence is required for their normal functioning.

Drawpd2TVL

Drawpd2TVLDrawpd2TVL is a ©MS Windows freeware that can be used to convert THERMOCALC output files into phase diagrams. It is a replacement for the standard Drawpd program included in the THERMOCALC package.

TieLines

TieLines
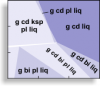
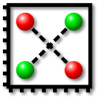
TieLines is a small ©MS Windows program for plotting rectangular and ternary diagrams with tie lines connecting points with equal identifiers.

TQ_Hist

TQ_Hist

TQ_Hist is a small program for plotting histograms in TriQuick. Histograms in TQ_Hist have horizontal axis with rational values, bars are placed between the borders of intervals (in contrast to standard ©MS Excel bar charts).

Approximation of reaction lines by single-segment parametric cubic Bezier curves

 Usage of parametric cubic Bezier curves on diagrams has a number of advantages if compared with traditional polyline representation (and with non-parametric curves)...

Format of TriQuick TVL files

 TVL-files (from "TriQuick oVerLay") contain simple vector images. These plain text files have very simple human-transparent format and can be created (or edited) either in TriQuick or in other programs (including text editors similar to Notepad). TVL images are specially oriented to use in rectangular diagrams (with two independently scaled axes) and in ternary diagrams (with 3 normalized axes). Therefore, diagram graphics have such specific features as:

  • Shrinking and stretching of objects (except line widths, text characters and markers in arrays of points) strongly depend on independent changes of scales of the axes;
  • Slopes of rectangles, ellipses and text objects are expressed in dX/dY ratios only (degrees are not used at all, at least in the current version).
Subscribe to RSS - Diagrams